No More Educated Guesses – How To Make The Most Of The New Additions To The Adwords Keyword Planner!

It might, to those who use it a lot, feel as though we’ve had the use of the Adwords Keyword Planner for a very long time indeed. It was, however, officially launched less than one year ago. To many it was a God send, neatly combining the Keyword Tool and the Traffic Estimator. Previously advertisers had to rely on both these tools separately which was a tedious and cumbersome, but unavoidable, activity to get new keywords, ad groups, traffic estimates, competitive bids and so on. The new Keyword Planner not only combined the functionality of the Keyword Tool and Traffic Estimator, but also brought with it some exciting new additions, such as the ability to target individual cities and regions as opposed to just countries, and the ability to see statistics relating specifically to an exact term. Arguably the grandest change was the new planner function, which gives users the ability to add ideas in terms of keywords and ad groups to a plan. Google has likened this plan to a ‘shopping cart’ where you could add and delete ideas and change your bid ranges to see the total estimated clicks and cost. When you were fully satisfied with this part of the process you could go on to review your plan and Google would show you a graph with daily performance estimates and a range of max cost per click bids. The joy didn’t end there though, Google also gives advertisers the opportunity to get more granular and obtain more accurate estimations. Now new options are available to update bids, budgets, targeting settings, keywords, keyword match types and ad groups to see all possible performance affects of any changes. When advertisers have created a plan they are comfortable enough to use they have the option of adding it to an existing campaign or applying it to a brand new campaign. If neither of these is an option for the present time it can be downloaded and implemented at a later date.
Now almost a year has passed since these changes and Google has announced more functions for the Keyword Planner. Unlike with some of their announcements, Google has hardly made a song and dance about these new additions; in fact they have been rather subtle about it. Maybe this was not the best way to roll them out in hindsight as keywords, after all, are at the heart of almost everything PPC professionals do, so anything that can aid us with finding new, potentially productive keywords is welcomed with open arms. Some researchers even estimate that advertisers dedicate almost 25% of their time to keyword research.
So what are these major new features and how can we strategically get the most from them?
New Additions To The Adwords Keyword Planner
First of all let’s take a look at some of the additional functions now available in the search volume section of the Keyword Planner; this is the section you will come across when you first access and begin using the planner.
- We’ve Got All The Time In The World – Users now have the ability to get search volume estimates and keyword suggestions for specific date ranges, as well as compare different time periods including the previous period, the same period during the previous year, or customised dates of your own. Many of the new features to the Keyword Planner come with an improvement in visualisation, this addition is no exception. You can view the search volume trends over time on a pretty new bar graph feature located nice and centrally at the top of the page, above your keyword suggestions. If you are doing a comparison Google will add an extra bar to each month for easy visualisation (see image below).
Tip! Hover your mouse over the individual bars and you will get to view details for each month separately.
- This new function can be particularly useful in looking at the seasonality of particular keywords. This is an important point to factor in when searching for new keyword opportunities, as performance and volume will change at certain times of the year and it isn’t always as obvious as you think, so make sure to do your research. You can make the most of this by using your newly discovered insight into what months of the year work better for those new keywords and what months have growth year on year, to then adjust your strategy and bids accordingly. This is the perfect opportunity to make sure you are using your budget wisely. If you need to make it stretch, know where to lower your bids, and raise your bids to make sure you aren’t limited by budget during your peak season!
- Location, Location, Location! – Another of the cool new visualisation features is the ability to see a breakdown of search volumes by your specified geographic targeting. To add or remove a location simply go to the ‘Targeting’ tab located at the top of left side of the screen. When selecting your locations you can get as granular as you like from comparing different countries, right down to comparing different cities, counties and regions. This new granularity in location continues through to the review stage of the keyword planner which we will discuss below.
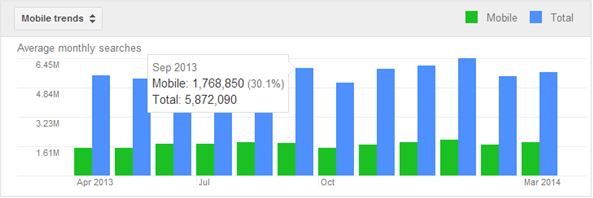
- Let’s Go Mobile – So it’s the year of the mobile. Yes sceptics go ahead and roll your eyes. We’ve been hearing people talk about paid search for mobiles for some time now and yet the change towards mobile as a focus never seemed to be as dramatic as it was assumed it would. Maybe the cause was early performance as advertisers saw poorer results on basic mobile campaigns Vs desktop. However, as time has gone by the detractors have had to seriously consider how they integrate mobile searches into their strategy. People really do use mobile now for almost everything… and they use them a lot! One of the key new features of the planner is being able to visually see how your chosen keywords mobile search trends alter over time, on another beautifully colourful bar graph. You can clearly see how mobile search volume compares to all other devices, and just as it is with the search volume trends, you can hold your mouse over each bar on the graph to see the actual figures. This is an excellent new feature to aid you in deciding how to set your mobile bid adjustments. It’s a great opportunity for those who got a little lost in the switch to enhanced campaigns last year to make up for some lost time and start being able to strategically set mobile bid adjustments based on actual data and trends. No more guesswork!
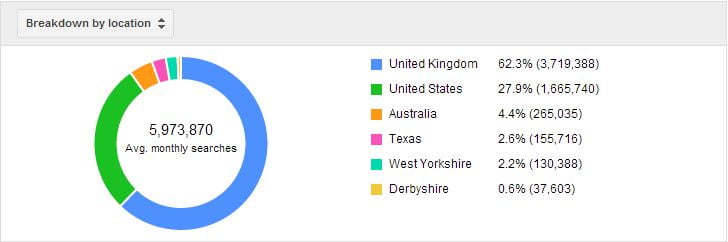
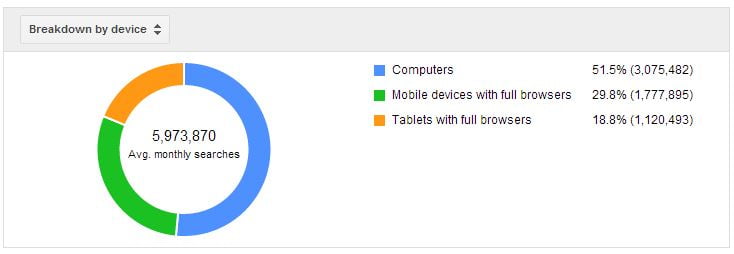
- Where Is It All Coming from? – Not only can you see how mobile volume compares with all other devices, but Google have now added another visual aid so you can see a breakdown by all devices too. This graph or donut chart, looks like the same graph you see for your targeted locations. You are able to see the actual search volumes, as well as a percentage, for your selected time period for computers, mobile devices and tablets.
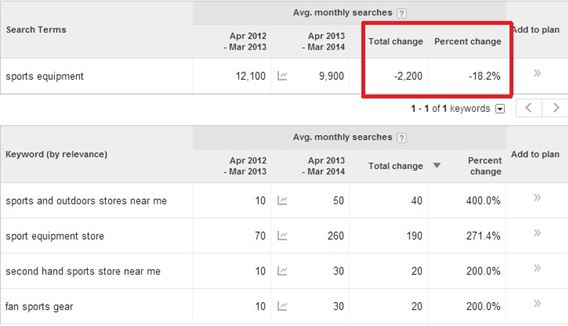
- Absolute & Relative – When comparing two different time periods be it this season with the last season, this year with last year or even this month with last month, you can now see both the absolute (total) change and the relative (percentage) change. These are located as additional columns next to your suggested keywords and ad groups. As an added bonus you can now also sort by these columns so you can truly see what keywords are in-flux or on the decline. Plus do not forget that all the data on your dashboard can be downloaded should you need to do some further manipulation before deciding what keywords to use.
Once you’ve chosen some ad groups and keywords to go into your plan you can then get estimates for various metrics including clicks, impressions, costs, and ad position and review your plan. As they have done with the search volume section of the planner, Google have now added lots more segmentation, granularity and other options to this section too.
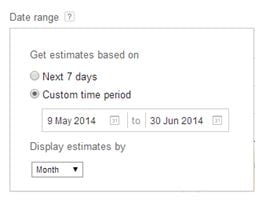
- Back To The Future – Again Google have allowed advertisers more freedom to decide what time periods their estimates are based on. They now have the ability to not just see daily estimates but also monthly, quarterly and annual estimates. What’s more is that you can also specify your own custom period of time on which the estimates are based.
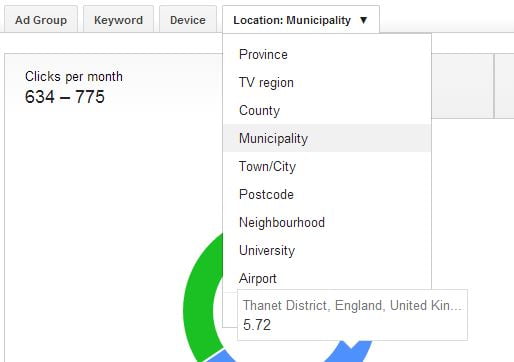
- Painting The Town Red – It would appear that Google have really gone to town on their location granularity, literally! As with the search volume trends you can now see estimates for your targeted countries, counties, cities and regions, however you can also see a breakdown by several other factors too including town, postal code, neighbourhood, and airport.
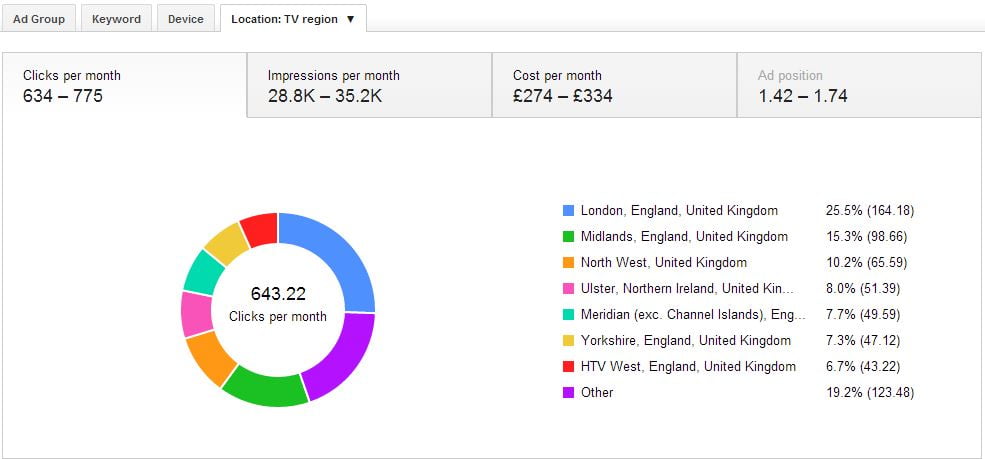
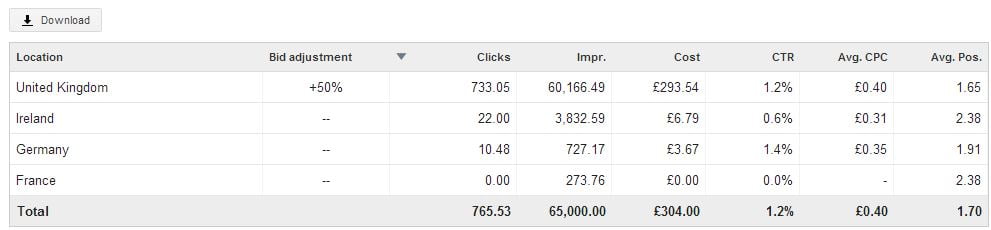
- By simply entering your bid and a daily budget into the two boxes at the top of the screen and setting your targeted countries (located in the same place as before) you can get estimates for clicks, impressions, cost and ad position. It is then all displayed on that stunningly colourful pie chart lookalike as we saw before, but within the box are four different tabs for your clicks, impressions, cost and ad position. The information is also available in a table below the graph section, but with additional metrics including click through rate, average cost per click and average position. As always this table is fully downloadable, should you need to play around with the data a little further.
- In addition to this you can also set bid adjustments for your targeted locations and see how these will pan out and impact on your vital metrics. Make sure you have a good play around with this to really get the most out of it, and don’t forget to adjust your time periods (as I mentioned above) so you can see more than just your daily estimates. Once you are comfortable finding your way around this tool make sure you put it to full use and implement some location bid adjustments, only if they are appropriate to your campaigns of course. Remember it makes no sense to bid on areas that convert very badly, you would be better off using that money more wisely on areas that do generate more quality traffic!
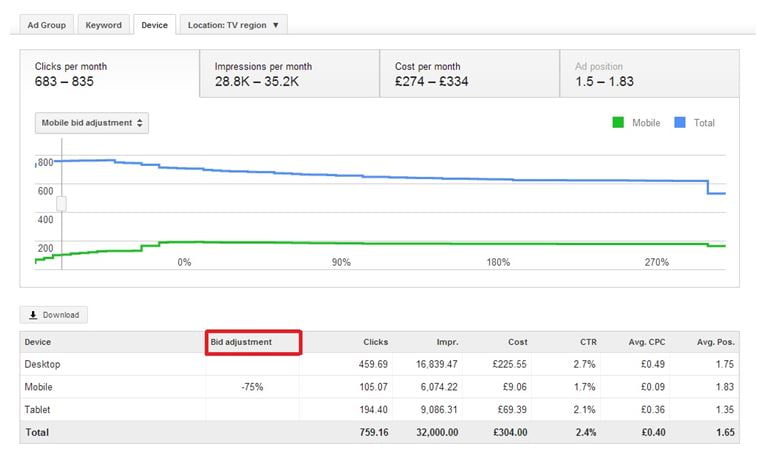
- The Divergent Device – The first thing to mention here is that much like the granularity with location, and the same as with the search volume trends, you now have the ability to see estimates broken down by device. Again once you have entered your bid and daily budget you can see estimates for clicks, impressions, cost, click through rate, average cost per click and average position split out by desktop, mobile and tablet. As above, the information is located in a downloadable table, but as with the location tab, you also have the ability to see it visually on a graph. For clicks, impressions and costs (each, again, located within their own sub-tab) you can see a line graph which tracks how changing your bid would potentially affect your volume. The image below demonstrates these features.
- The second feature to mention in the devices tab is the new ability to set a mobile bid adjustment (highlighted in red on the image below). This is in our opinion very cool as it allows you to see how different bid adjustments might affect the expected contribution of individual devices. DO NOT disregard this new tool within the keyword planner! It gives you the ability to make informed, logical bid adjustments based on the holistic view, something that was near on impossible before and can still be deemed as difficult task. Due to offline conversions, cross device conversions and limited or no call tracking, advertisers previously made arbitrary bid adjustments to measure the impact, but that no longer needs to be the case. With this new insight you should be able to make the most of your campaigns, not just in terms of bids, but also in knowing which campaigns need a mobile preferred ad and mobile preferred call extension.
With Great Power Comes Great Responsibility
Although this is the first great update to the Keyword Planner as we said at the start of this article Google were very quiet about it and it’s hard to know exactly why. These improvements are arguably a lot more exciting than some of the other releases by Google that Google have, in the past, very publicly showcased. These new functions and features upgrade the Keyword Planner from being just a useful aid to being an essential and incredibly powerful tool. New mobile and location bid adjustment simulations force the Keyword Planner to make a necessary transformation to a new ‘connected world’, accepting that people use all devices, all the time, from all kinds of locations, allowing advertisers to send the right messages and make the right bid modifications, to get the right results. On top of that there is no longer a need to get sucked into a sea of distracting or confusing numbers. The new, brightly coloured visualisation features are immensely appealing, making various metrics and segmented data easier to understand for you or the client.
So whether you’re a PPC Professional, a newcomer or an online trader, we recommend you start using the keyword planner and see what insight you can find.